Category: Product
-

Troubleshoot Data load process faster with process debugging
TI process ran successfully but your data is not correct.
-
Arc v1.1 is now available to download
After months of development and feedback from customers and consultants all around the world…. Arc v1.1 is now available to download!
-

Trialling and Buying Arc
IMPORTANT: To trial, buy or update licenses the browser hosting the Arc user interface needs to be able to access the internet. If you are accessing Arc on a server it is possible that you will not be able to connect to the internet, if you have issues connecting try using your desktop computer instead.
-

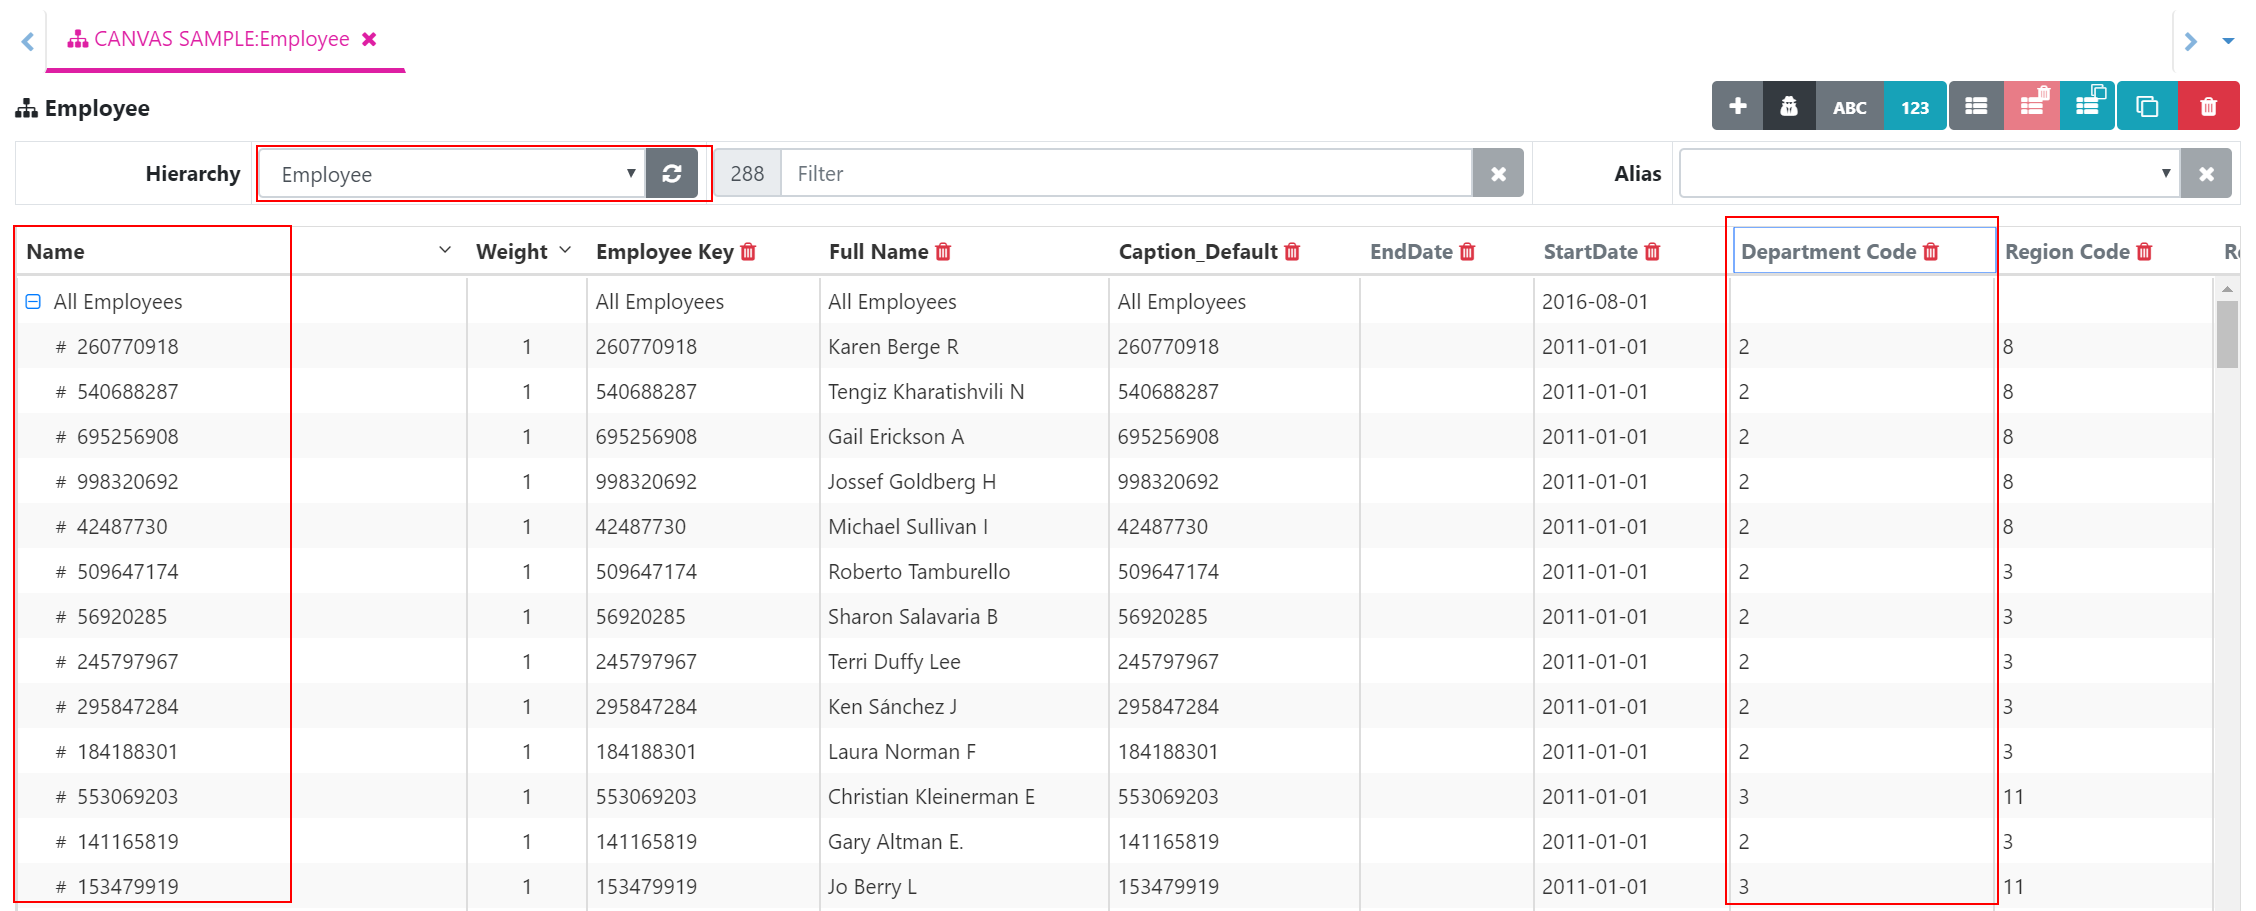
Adding new elements from Excel into the Hierarchy editor
Arc supports creating new elements from Excel with the element type:
-

Filtering the search by instance and objects
Since Arc v1.0.0, the search results can be filtered by instance (i) and objects type (t).
-
Managing sessions timeout in Arc
There are two types of session timeouts in Arc:
-

Mastering hierarchies in IBM Planning Analytics (TM1)
With IBM TM1 10.2.2 end of support coming in September 2019 now is an ideal time to consider upgrading to IBM Planning Analytics.
-
Building a new Hierarchy with a new process
In this article you will learn how to build a new Hierarchy based on attribute values.
-
Randomise your data in an instant
The most common reason why you would need to obfuscate/scramble your data is if you need to send your data to third parties. One way to do it, is to randomize the values. The metadata (cubes, dimensions and elements names) will still be intact but the data will be randomised.You could do it manually by…
-

Run processes in parallel using only one TM1 connection
Being able to run processes in parallel is one of the most powerful features of IBM TM1 and Planning Analytcs. Instead of loading one year of data with one process, you could run in parallel one process per month which will significantly speed up your loading time!